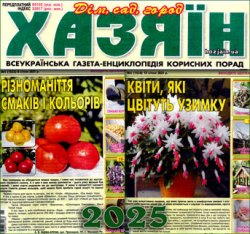
 Название: газета «Хазяїн. Дім, сад, город»
Номер/дата выпуска: № 1 (1523) 8 січня – 2 (1524) 15 січня, 2025
Редактор: Заїка В.М.
Изд-во: ТОВ «ВД "Хазяїн"»
Страниц: по 32 (без рекламы)
Формат: PDF
Размер: 74,85 Мб
Язык: українська
"Хазяїн. Дім, сад, город" – газета-енциклопедія корисних порад, яка поповнюється сотнями рекомендацій від читачів і професіоналів, - це справжня настільна книга для вмілого господарювання!
«СІМЕЙНА СТРАВА» * «КУМА ЗНАЄ ВСЕ» * «СКАРБНИЧКА» * «ПОРАДИ ДО ЧАСУ»: зимові турботи в саду * «З МІСЯЦЯ В МІСЯЦЬ» * «НА ПІДВІКОННІ ТА БІЛЯ» * «ЕКЗОТИ» * «ДАЧНА ШКОЛА» * «САД»: зимова обрізка; урожайна крона * «ЗАХИСТ» (годівнички для птахів) * «ПАСІКА»: хвороби бджіл * «ВИНОГРАДНИК» * «ПРЯНІ ТА ЛІКАРСЬКІ» * «ЖИВИЙ КУТОЧОК»: черепаха * «ДОМАШНЯ ФЕРМА» * «ЗРОБИ САМ» * «ЯК БУТИ» * «РУКОДІЛЬНИЦЯ» * «СІМЕЙНИЙ КОВЧЕГ» * «ЛІКУВАЛЬНА КРАМНИЦЯ» * «НАРОДНА МЕДИЦИНА»

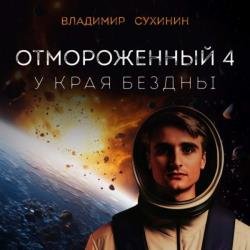 Название: Отмороженный-4. У края бездны
 Название: Прорвёмся, опера! Книга 1
 Название: Ягор Дайч. Книга 1
 Название: Древнее китайское проклятие
 Название: Артефактор. Книга шестая
 Название: Артефактор. Книга седьмая
 Название: Найденов Дмитрий - Артефактор. Книга восьмая