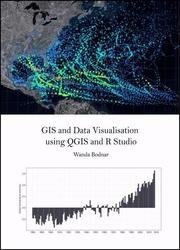
 Название: GIS and Data Visualisation using QGIS and R Studio
 Автор: Wanda Bodnar
Издательство: Leanpub
Год: 2018-10-19
Страниц: 216
Язык: английский
Формат: pdf (true), epub
Размер: 134.2 MB
Working through this book you will develop basic skills needed to use both QGIS and R Studio. Specifically, you will learn how to use the various data visualisation packages in R Studio, and how to use both QGIS and R Studio interchangeably for mapping purposes. Whilst learning to create interactive maps and graphs, you will also gain more knowledge about the basics of marine and climate science, and the impact of climate change on our Planet.
Here are some of the topics covered:
Introduction to R Studio
Basic data analysis
Visualising data in R Studio (making both static and interactive plots)
Introduction to Cartography and Mapping
Introduction to GIS and QGIS
Mapping with QGIS and R Studio (creating both static and interactive maps)
Introduction to R Markdown
Introduction to web mapping using Leaflet.js in R Studio
Using GitHub
Webscrapping using R Studio
Creating and working with shapefile and geojson format
Using OpenStreetMap data
Geocoding and georeferencing
Adding geotagged pictures to a map
Introduction to ArcGIS Earth and Google Earth
Скачать GIS and Data Visualisation using QGIS and R Studio