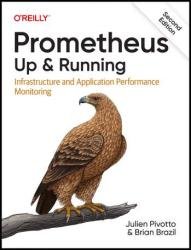
 Название: Prometheus: Up & Running: Infrastructure and Application Performance Monitoring, 2nd Edition (Final Release)
Автор: Julien Pivotto, Brian Brazil
Издательство: O’Reilly Media, Inc.
Год: 2023
Страниц: 415
Язык: английский
Формат: epub (true)
Размер: 10.2 MB
Get up to speed with Prometheus, the metrics-based monitoring system used in production by tens of thousands of organizations. This updated second edition provides site reliability engineers, Kubernetes administrators, and software developers with a hands-on introduction to the most important aspects of Prometheus, including dashboarding and alerting, direct code instrumentation, and metric collection from third-party systems with exporters.
Prometheus server maintainer Julien Pivotto and core developer Brian Brazil demonstrate how you can use Prometheus for application and infrastructure monitoring. This book guides you through Prometheus setup, the Node Exporter, and the Alertmanager, and then shows you how to use these tools for application and infrastructure monitoring. You'll understand why this open source system has continued to gain popularity in recent years.
Prometheus is primarily written in Go and licensed under the Apache 2.0 license. For instrumenting your own code, there are client libraries in all the popular languages and runtimes, including Go, Java/JVM, C#/.Net, Python, Ruby, Node.js, Haskell, Erlang, and Rust. Many popular applications are already instrumented with Prometheus client libraries, like Kubernetes, Docker, Envoy, and Vault. For third-party software that exposes metrics in a non-Prometheus format, there are hundreds of integrations available. These are called exporters, and include HAProxy, MySQL, PostgreSQL, Redis, JMX, SNMP, Consul, and Kafka. A friend of Brian’s even added support for monitoring Minecraft servers, as he cares a lot about his frames per second.
The data model identifies each time series not just with a name, but also with an unordered set of key-value pairs called labels. The PromQL query language allows aggregation across any of these labels, so you can analyze not just per process but also per datacenter and per service or by any other labels that you have defined. These can be graphed in dashboard systems such as Grafana and Perses.
Alerts can be defined using the exact same PromQL query language that you use for graphing. If you can graph it, you can alert on it. Labels make maintaining alerts easier, as you can create a single alert covering all possible label values. In some other monitoring systems you would have to individually create an alert per machine/application. Relatedly, service discovery can automatically determine what applications and machines should be scraped from sources such as Kubernetes, Consul, Amazon Elastic Compute Cloud (EC2), Azure, Google Compute Engine (GCE), and OpenStack. For all these features and benefits, Prometheus is efficient and simple to run.
You will:
Know where and how much instrumentation to apply to your application code
Monitor your infrastructure with Node Exporter and use new collectors for network system pressure metrics
Get an introduction to Grafana, a popular tool for building dashboards
Use service discovery and the new HTTP SD monitoring system to provide different views of your machines and services
Use Prometheus with Kubernetes and examine exporters you can use with containers
Discover Prom's new improvements and features, including trigonometry functions
Learn how Prometheus supports important security features including TLS and basic authentication
Скачать Prometheus: Up & Running, 2nd Edition (Final Release)